Please check your data first and then fit the model
NIST ABACUS Chemical Analysis Package: Measurement Calibration
About ABACUS
The NIST ABACUS (Apps for Bayesian Analysis of Chemical quantities Using Shiny) package is a software application designed to help chemical analysts make well-informed decisions and perform rigorous calculation of results.
ABACUS is comprised of three modules that can be used separately or in any combination during the measurement process:
1) Pre-Experiment
Exploratory measurement data is analyzed to inform an approximate expectation of the measured quantity and an efficient set of experiments. The Pre-Experiment module calculates estimates for several characteristics of the measurement procedure that can inform the Design of Experiment .
2) Design of Experiment
A central function ABACUS is the planning of optimal experiment designs to achieve a target measurement uncertainty. Based on results from the Pre-Experiment module, or simply estimated inputs based on user judgement, this module determines an experiment design that can achieve the target uncertainty with as few measurements and prepared samples as possible.
3) Analysis
The Analysis module uses all data from the experiments to calculate a result with a rigorous estimate of measurement uncertainty. Calibration methods based on linear regression models or response factors are supported, as is the use of internal or external standards. Data from calibrations performed on separate days or by different methods can be utilized to inform the result.
ABACUS performs calculations for measurements that are based on two-step experiments conducted to:
1) estimate a calibration function
2) determine unknown quantities of analyte in samples using the calibration function and sample measurement data
The statistical approaches employed for the Pre-Experiment and Analysis modules are described in:
Statistical Approach: ID-LC-MS ModelABACUS calculations are based on the following measurement equtions:
1) Calibration
a) Using Internal Standards:
Linear Regression Model
Quantities of analyte (A) : internal standard (I), \(k_{S}\), in a measured sample can be calculated as:
\( k_{S} = \displaystyle{\frac{R_{S}-a}{b}}\),
where a and b are coefficients of a linear regression determined from the measurement of n number of calibrants:
\(R_{C_{i}}= a + b \times k_{C_{i}}, i = 1, . . ., n\),
\(R_{C_{i}} = \displaystyle{\frac{Measured\ Response\ of\ A}{Measured\ Response\ of\ I}}\) in calibrant \(i\),
and
\(k_{C_i} = \displaystyle{\frac{quantity\ of\ A}{quantity\ of\ I}}\) in calibrant \(i\);
Response Factor Model
\(R_{C_{i}}= b \times k_{C_{i}}, i = 1, . . ., n\)
b) Using External Standards:
Equations for calibration approaches using external standards are similar to those above for use with internal standards except that:
\(R_{C_{i}}=\) measured response of A in calibrant \(i\),
\(k_{C_i}=\) quantity of A in calibrant \(i\)
2) Sample Measurement
Equations below are the same for procedures based on either Linear Regression or Response Factor calibration models
a) Using Internal Standards:
\(R_{S} = \displaystyle{\frac{Measured\ Response\ of\ A}{Measured\ Response\ of\ I}}\) in a measured sample
An estimate of \(k_{S}\) for each sample can be determined from the calibration model and the corresponding observation of \(R_{S}\). The measured quantity of analyte in each sample, \(w_{A}\), is then calculated as:
\(w_{A}=\displaystyle{k_{S} \times \frac{m_{I_{S}}}{m_{S}} }\)
where,
\(m_{I_{S}}=\) quantity of internal standard added to the sample,
\(m_{S}=\) quantity of sample substance
b) Using External Standards:
Equations for samples without an internal standard (calibration using external standards) are similar as those above except that:
\(R_{S}=\) measured response of A in a sample,
\(w_{A}=\displaystyle{\frac{k_{S}}{m_{S}} }\)
Quick Start: Pre-Experiment
Data Entry
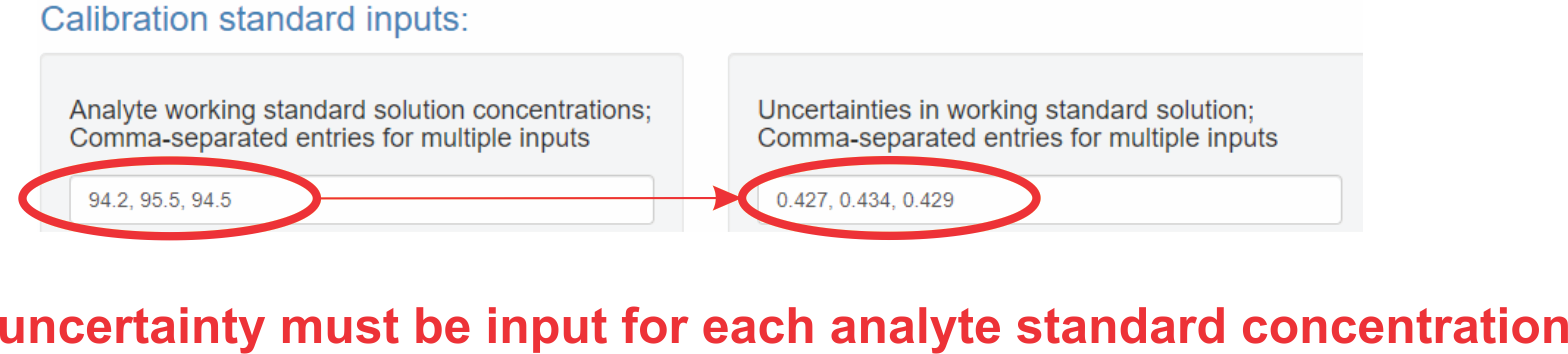
Enter known concentrations of analyte in working standard solutions used to prepare calibrants. Multiple working standard concentrations can be input, values separated by commas. An uncertainty estimate of each concetration is required.
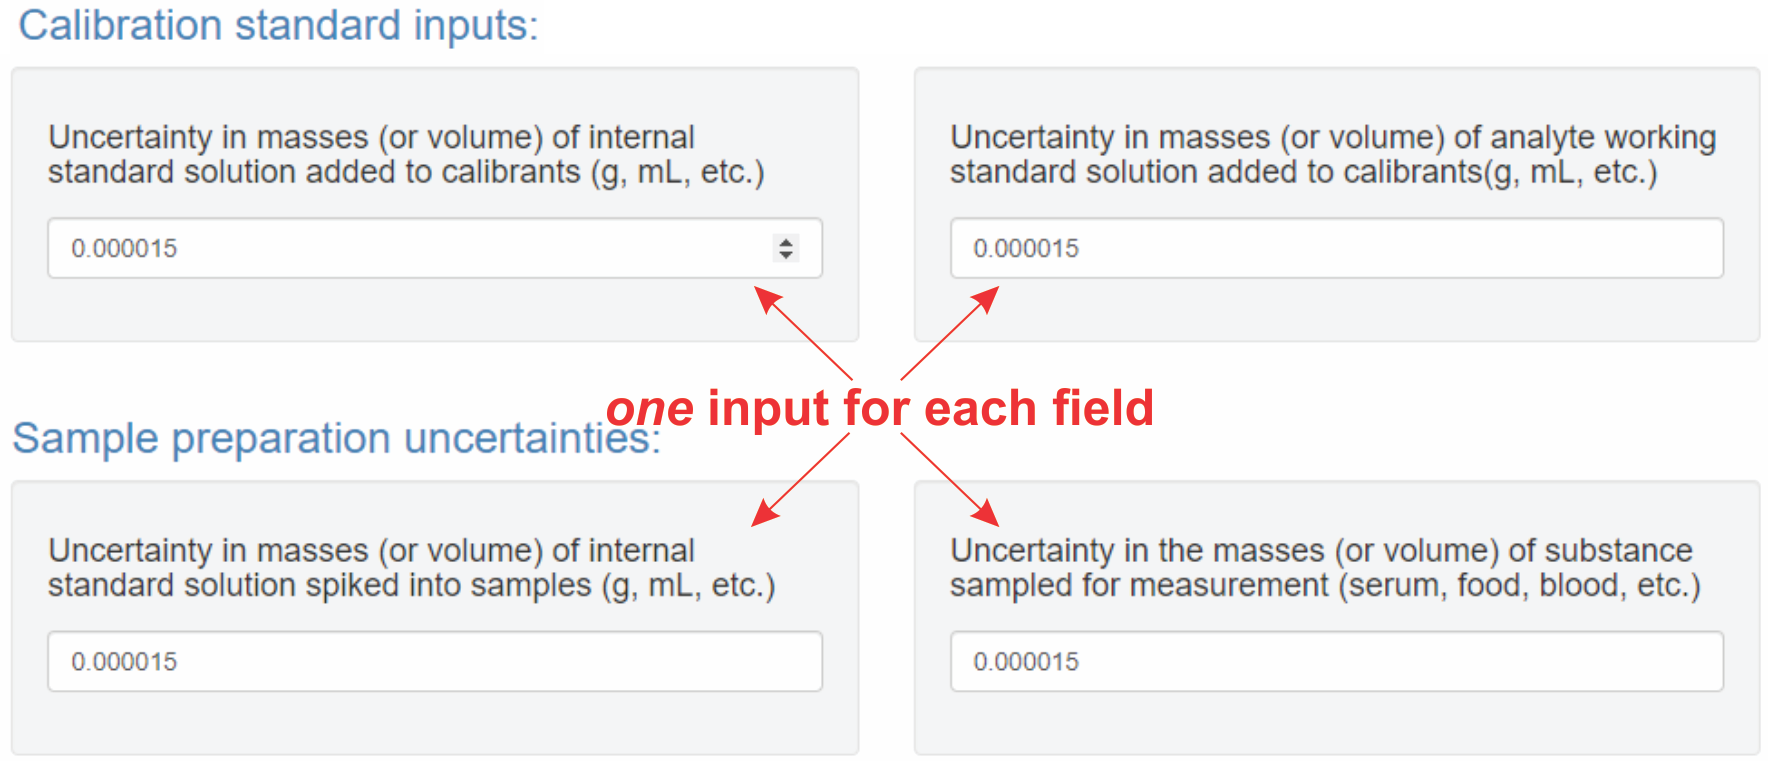
Enter uncertainties associated with adding analyte and internal standard quantities to calibrants.
Enter uncertainty of internal standard quantities added to samples. Enter uncertainty of sample substance aliquot (e.g., serum matrix sample)
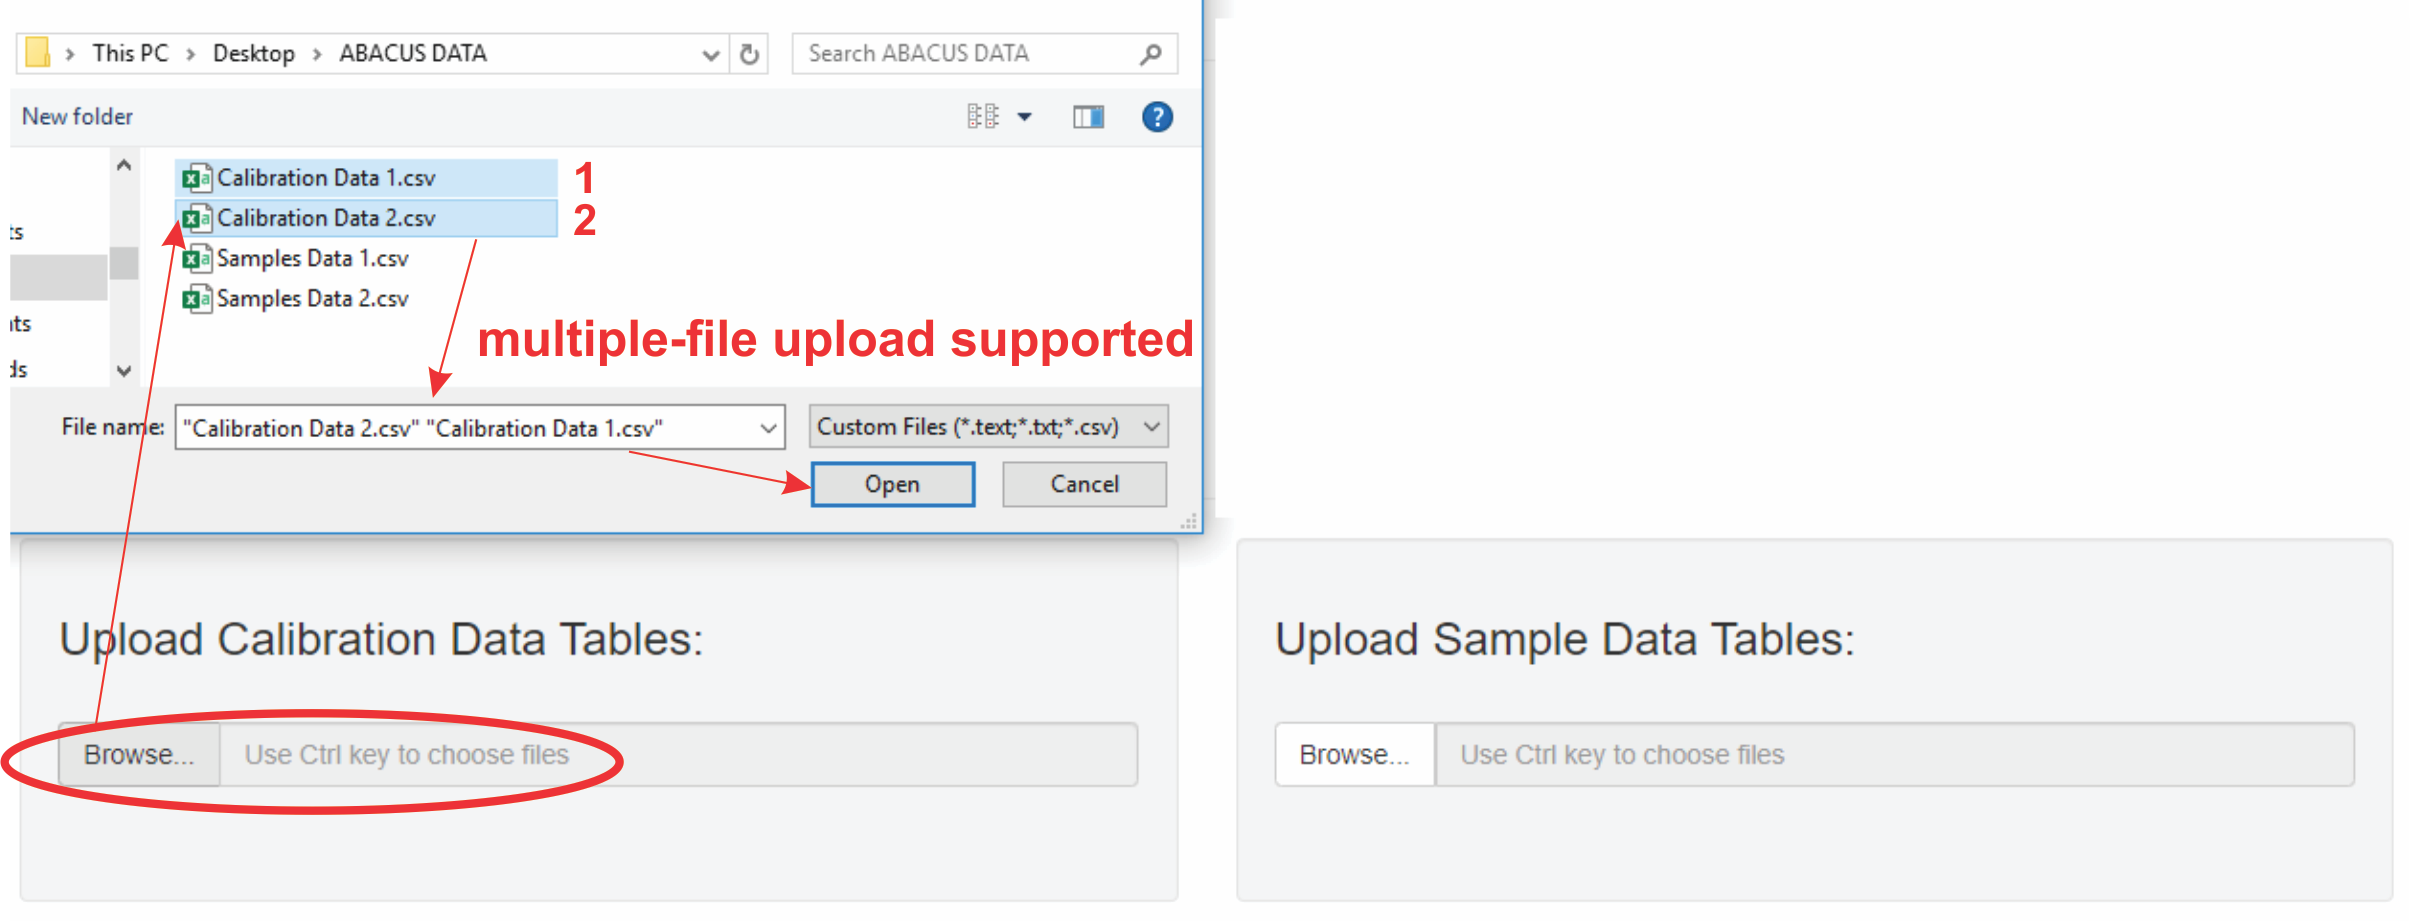
Data Table Upload
Experiments that generate multiple calibration curves to determine a single result are supported. For example:
- measurements conducted over several days with separate calibrations
- employment of multiple different techniques using internal standards
Multiple data files can be uploaded simultaneously. Upload calibration and corresponding sample tables in the same order.
Calibration Data Tables
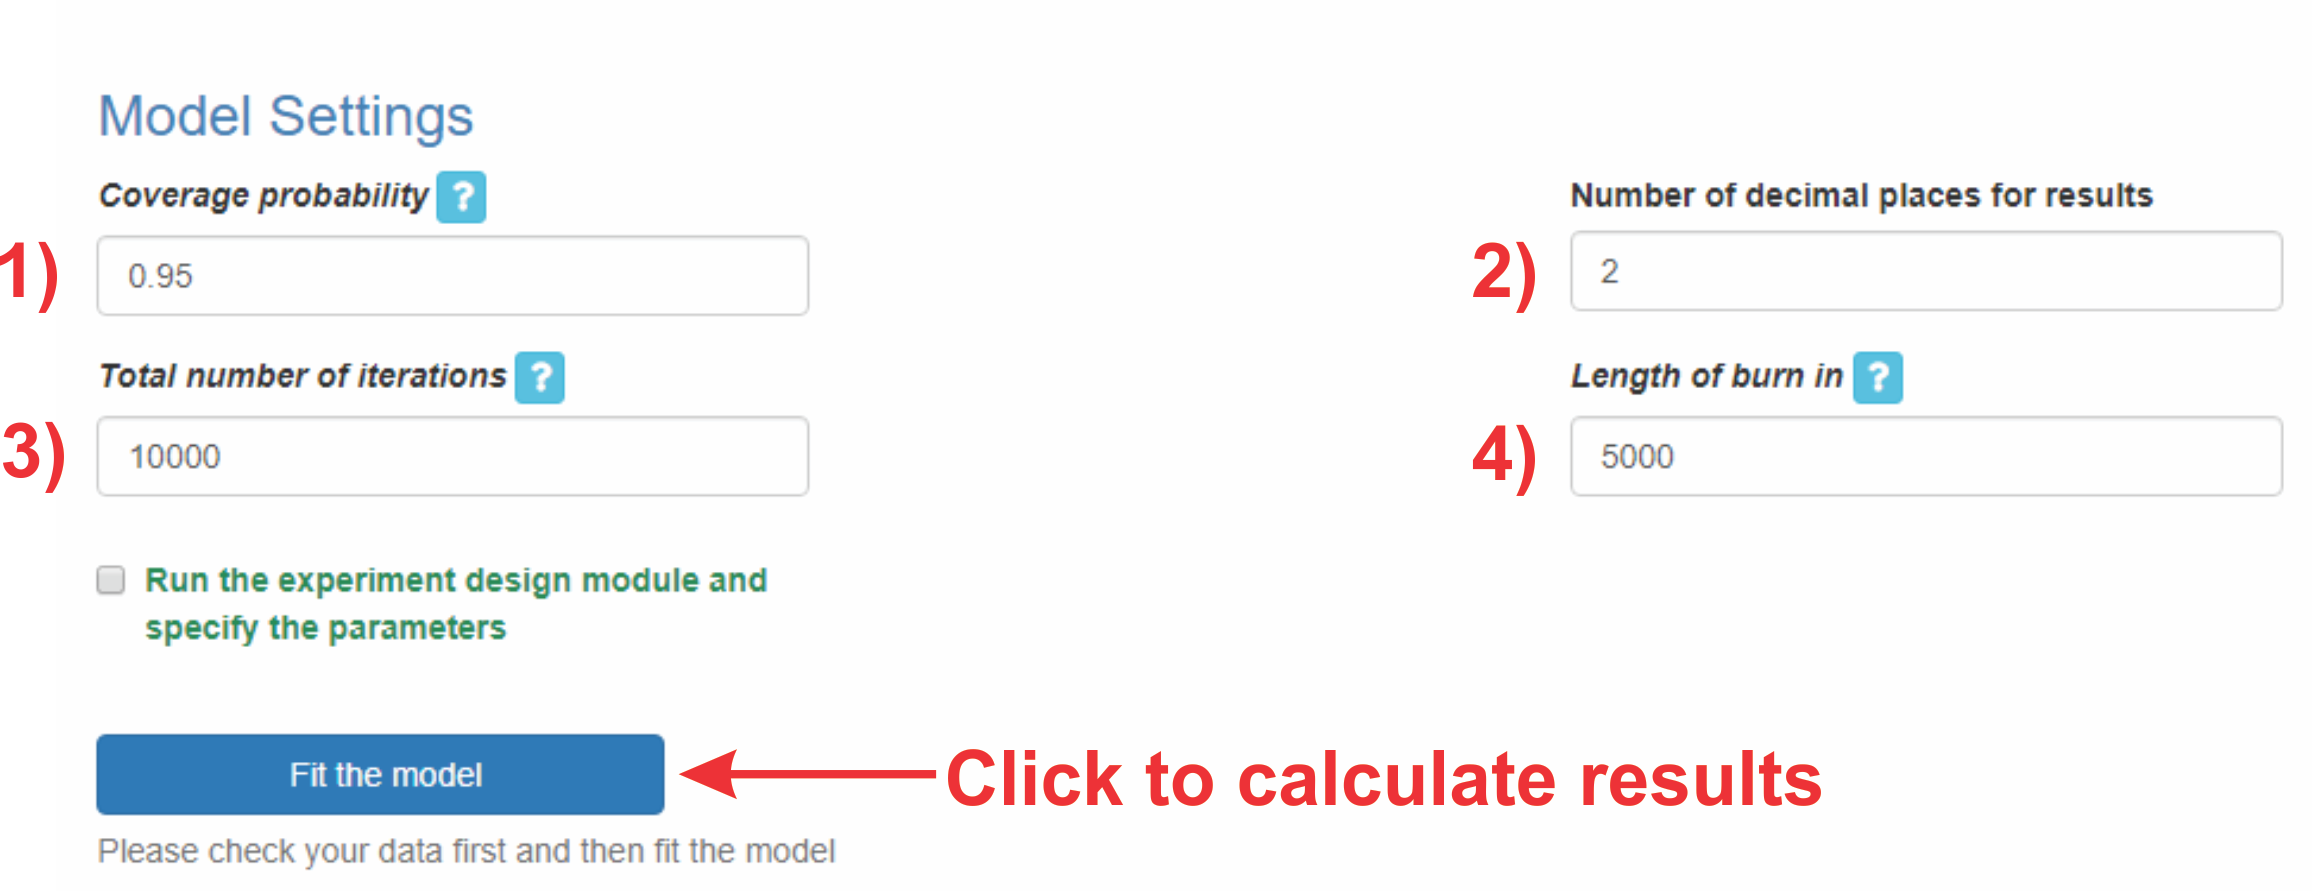
Model Settings
1) Specify coverage interval of estimated result. Default is 95 %.
2) Indicate destired number of decimal places printed for results
3) Total number of iterations should be adjusted if app indicates that more iterations are needed
4) Length of burn in should only be increased if app indicates that the model has not converged. Do not decrease this value.
Choose a method of calibration
Upload Data Tables:
X data:
mid: Quantity (mass or volume) of internal standard added to calibrant(Only for internal standard use)
mad: Quantity (mass or volume) of analyte working standard solution in calibrant
Analyte working standard solution ID # (e.g. 1, 2)
Y data:
raci: Analyte: Internal Standard Peak Areas Ratio for calibrant repeat measurement i
X data:
mids: Quantity (mass or volume) of internal standard in sample(Only for internal standard use)
Quantity (mass or volume) of analyzed sample substance (e.g., serum sample)
Y data:
rasi:Analyte: Internal Standard Peak Areas Ratio for sample repeat measurement i
Model Settings
1. About Design of Experiment
This module produces experiment designs for chemical measurement procedures based on the calibration methods supported by ABACUS. This experiment design guarantees that the relative standard uncertainty of the measurement result will be less than a user-specified maximum value.
In addition to the maximum relative uncertainty, the app requires prior information about various aspects of the measurement procedure. This information can be based on experimental evidence or expert opinion.
Estimates of experimental parameters calculated with the Pre-Experiment module can be directly transferred as inputs into this Design of Experiment module
2. Inputs:
Inputs are provided with results of the Pre-Experiment module. They can also be estimates based on the analyst's judgement.
Note: for a method of calibration using external standards, values for observations of A:I described below can simply be entered as the respective values for A.
1. Specify the total number of measurements that can be performed. This includes the number of calibrants, available samples, and repeat measurements.
2. Specify the Target maximum relative (%) standard uncertainty
3. Provide an approximate expected value of the measurand
4. Provide a range of possible expected values of the slope of your calibration line, e.g. 1.2 to 1.4.
5. Identify the target calibration region (x-axis); this is an interval in terms of the the ratios of concentrations of A:I in the calibrants.
6. Provide a range of values (uy) for the expected standard deviation of peak area ratios (A:I) determined from repeated measurement of a calibrant.
7. Provide a range of values (ux) for the expected standard uncertainties of concentrations (A:I) in calibrants. Or, provide a range of values (rux) for the expected relative standard uncertainty of the concentrations (A:I) in calibrants. Input of at least one of these ranges is required. ux can be 0 if rux > 0; rux can be 0 if ux > 0
8. Provide a range of values for the expected relative standard uncertainties of the concentrations of I in samples. For calibration methods using external standards, this should be 0.
9. Provide a range of values for the expected between-sample variability (standard deviation) of the peak area ratios (A:I), e.g., variability due to replicate sample preparation and heterogeneity.
3. Results
Once this information is entered, the App will produce an experiment design that can acheive an expected relative standard uncertainty of the measurand that is less than or equal to the specified maximum. If there are not enough samples available to achieve the Target maximum relative (%) standard uncertainty, ABACUS will indicate the smallest possible uncertainty under the specified experimental conditions and inputs. Specifically, it will give:
1. The number of calibrants and the concentration ratios of A:I; for calibration methods using external standards, the concentrations of A.
2. The number of repeat measurements recommended for each calibrant.
3. The number of samples.
4. The number of repeat measurements recommended for each sample.
Choose a method of calibration
Please check your data first and then fit the model
Loading...
Quick Start: Analysis
Data Entry
Enter known concentrations of analyte in working standard solutions used to prepare calibrants. Multiple working standard concentrations can be input, values separated by commas. An uncertainty estimate of each concetration is required.
Enter uncertainties associated with adding analyte and internal standard quantities to calibrants.
Enter uncertainty of internal standard quantities added to samples. Enter uncertainty of sample substance aliquot (e.g., serum matrix sample)
Data Table Upload
Experiments that generate multiple calibration curves to determine a single result are supported. For example:
- measurements conducted over several days with separate calibrations
- employment of multiple different techniques using internal standards
Multiple data files can be uploaded simultaneously. Upload calibration and corresponding sample tables in the same order.
Calibration Data Tables
Model Settings
1) Specify coverage interval of estimated result. Default is 95 %.
2) Indicate destired number of decimal places printed for results
3) Total number of iterations should be adjusted if app indicates that more iterations are needed
4) Length of burn in should only be increased if app indicates that model has not converged. Do not decrease this value.
Choose a method of calibration
Upload Data Tables:
X data:
mid: Quantity (mass or volume) of internal standard added to calibrant(Only for internal standard use)
mad: Quantity (mass or volume) of analyte working standard solution in calibrant
Analyte working standard solution ID # (e.g. 1, 2)
Y data:
raci: Analyte: Internal Standard Peak Areas Ratio for calibrant repeat measurement i
X data:
mids: Quantity (mass or volume) of internal standard in sample(Only for internal standard use)
Quantity (mass or volume) of analyzed sample substance (e.g., serum sample)
Y data:
rasi:Analyte: Internal Standard Peak Areas Ratio for sample repeat measurement i
Model Settings
Please check your data first and then fit the model
Loading...